Each cricket statistic answers one question. Batting average relates runs to dismissals, batting strike rate measures scoring speed, and bowling average, strike rate and economy cover three different parts of bowling. How useful a comparison is depends on format, player role, innings phase and sample size.
Which Cricket Statistic Should You Look At First?
A batter scores 45 runs. That number tells you far more once you know whether it took 30 balls or a long, patient innings. Each column answers a different question, so start with the one that matches yours.
| Your question | Statistic | Unit | Useful direction | Cross-check |
|---|---|---|---|---|
| How many runs between dismissals? | Batting average | Runs per dismissal | Higher | Innings and not-outs |
| How quickly does a batter score? | Batting strike rate | Runs per 100 balls | Higher means faster | Format and innings phase |
| What does each bowling wicket cost? | Bowling average | Runs conceded per wicket | Lower | Wickets credited |
| How frequently does a bowler take wickets? | Bowling strike rate | Legal balls per wicket | Lower means more frequent wickets | Bowling role |
| How much scoring does a bowler allow? | Economy rate | Runs per six legal balls | Lower | Match phase |
If you need wickets, bowling strike rate matters most. If you need to keep scoring down, start with economy. The two strike rates point in opposite directions: a higher batting figure means faster runs, while a lower bowling figure means faster wickets. The net run rate guide moves from a single spell or innings to a team's scoring and conceding across qualifying matches.

Batting Average: Why Dismissals and Not-Outs Matter
Batting average divides a batter's total runs by the number of times the batter has been dismissed. A not-out is not a dismissal, so the denominator can be smaller than the number of innings.
Batting average = total batting runs ÷ dismissals.
Take a fictional record of 240 runs and six dismissals. The average is 240 ÷ 6 = 40.00, or 40 runs per dismissal.
An asterisk, as in 45*, means 45 not out. Those runs count toward the total, but the innings adds no dismissal. An average therefore moves with both the runs scored and the number of dismissals.
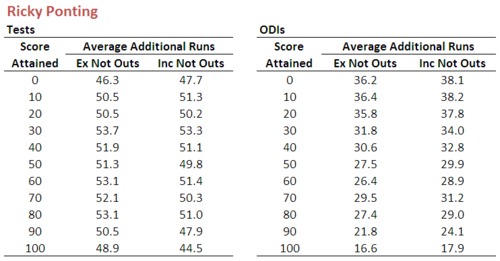
A batter who has never been dismissed has no average, because the denominator is zero. Stats pages show a dash.
To work out an average from several innings, count the dismissals first, then divide total runs by that count. Two batters on the same run total can have different averages if one has been dismissed more often.
Batting Strike Rate: How Fast a Batter Scores
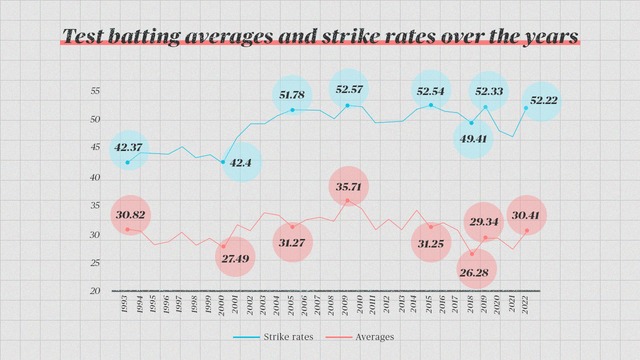
Batting strike rate measures scoring speed in runs per 100 balls faced.
Batting strike rate = runs × 100 ÷ balls faced.
A batter who makes 45 from 30 balls has a strike rate of 45 × 100 ÷ 30 = 150.0.
Average and strike rate often sit side by side on a player record. An average of 40 gives runs per dismissal, while a strike rate of 150 gives runs per 100 balls.
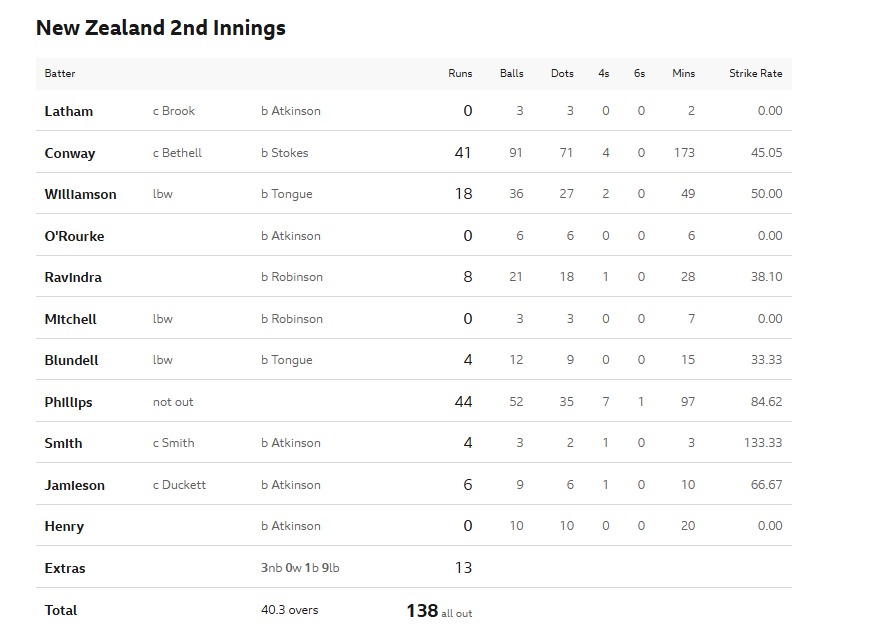
A T20 finisher with a few balls left has to score fast. A Test opener may need to survive difficult new-ball bowling. Read strike rate against that role. With zero balls faced, the rate is undefined.
Bowling Average, Economy and Strike Rate: Three Different Jobs

Bowling average measures the run cost of wickets, bowling strike rate measures how often wickets arrive, and economy measures runs conceded per over.
Take an eight-over spell: 48 legal balls, 60 runs conceded and three wickets.
| Statistic | Formula for the spell | Result | Meaning |
|---|---|---|---|
| Bowling average | 60 ÷ 3 | 20.0 | Runs conceded per wicket |
| Bowling strike rate | 48 ÷ 3 | 16.0 | Legal balls per wicket |
| Economy rate | 60 × 6 ÷ 48 | 7.50 | Runs conceded per six-ball over |
The identity economy × bowling strike rate ÷ 6 = bowling average gives 7.50 × 16 ÷ 6 = 20.0 for this spell. It follows from the formulas for a six-ball over.
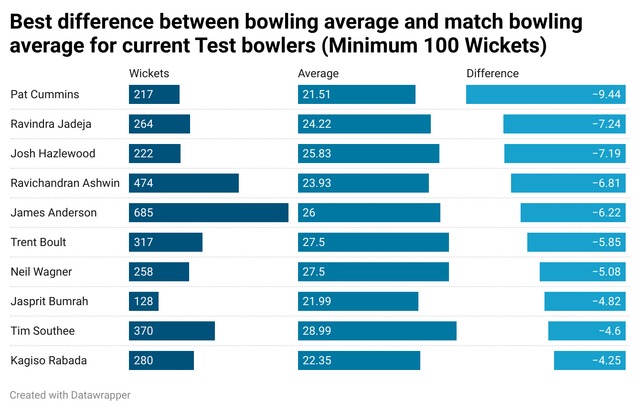
Now compare two bowlers whose averages match:
- Bowler A: 40 runs conceded, two wickets and 48 legal balls. Average 20.0; economy 5.00; bowling strike rate 24.
- Bowler B: 40 runs conceded, two wickets and 24 legal balls. Average 20.0; economy 10.00; bowling strike rate 12.
A's lower economy suits a side that needs to contain runs. B's lower strike rate suits a side that needs wickets often. The matching averages hide that difference.
With no wickets, economy still works once balls have been bowled, but average and strike rate are undefined.
Overs, Extras and Wickets: Three Ways Statistics Go Wrong
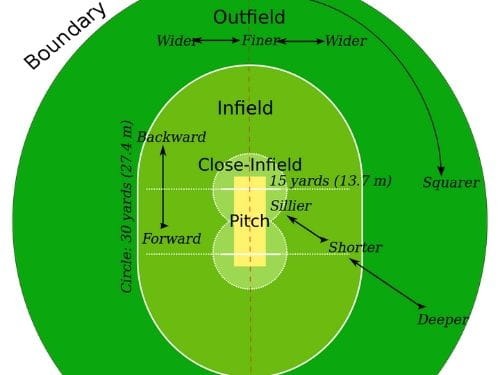
The overs column counts completed overs, then legal deliveries in the unfinished over. In a six-ball over, 3.4 means three complete overs plus four balls: 3 × 6 + 4 = 22 legal deliveries.
A bowler who conceded 29 runs in those deliveries has an economy of 29 × 6 ÷ 22 = 7.91 runs per over, rounded to two decimal places.
Extras change the accounting
| Event | Team scoring effect | Bowler accounting |
|---|---|---|
| Wide | One-run penalty plus any runs completed or boundary allowance, all scored as wides | Wide runs are charged to the bowler; the delivery is not legal |
| No-ball | Penalty plus any runs scored on the delivery | Penalty and bat runs are charged to the bowler; byes and leg-byes stay with the team; the delivery is not legal |
| Bye | Team extras | Not charged to the bowler |
| Leg bye | Team extras when the scoring conditions are met | Not charged to the bowler |
| Run-out | Team wicket lost | Normally not credited to the bowler |
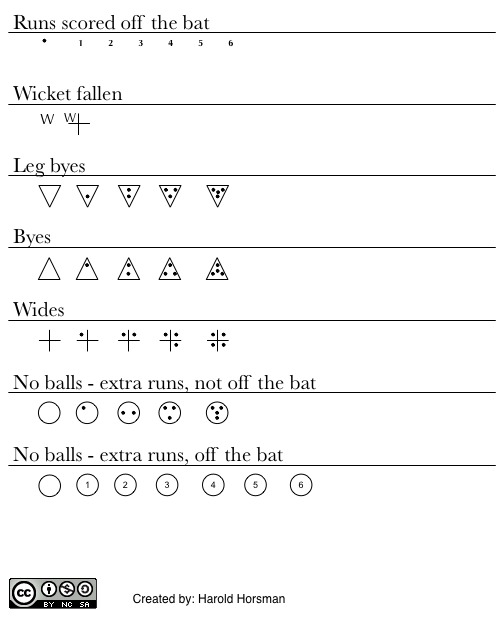
The MCC Laws of Cricket set the standard rules, and competition playing conditions can vary them.
ECB Play-Cricket's extras-scoring guidance separates wides, no-balls, byes and leg-byes in its scoring interface.
On a bowler's O-M-R-W line, the letters stand for overs, maidens, runs conceded and wickets. A maiden has no runs charged to the bowler, though byes or leg-byes may add to the team's total.
When you use overs in a formula, convert them to legal balls and take R and W from the bowler's own line.
Why the Same Cricket Number Can Mean Different Things
Format, role, conditions and sample size all change what a rate means. A death-overs bowler and a new-ball bowler do different jobs, and their economy rates reflect that.
A r/Cricket poster questioned how fair raw comparisons are across pitches, outfields and weather, and floated an adjusted impact rating:
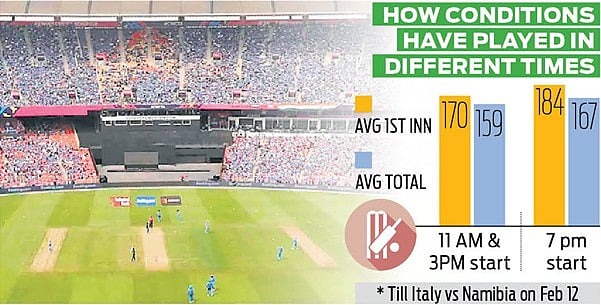
With different outfield sizes, varied batting pitches and unpredictable weather, is the emphasis placed on data when comparing players really fair? This shows up most in T20s. In some games a score of 130 to 140 is seen as competitive, while in other places anything under 180 or 190 is considered below par - and a score above 200 is par. That creates a big gap when comparing bowlers and batters who play whole series in certain conditions. I would say the only format where statistics still have stronger value is ODIs. Even Test cricket is heavily shaped by conditions. Soil, weather and the outfield can decide whether seam and pace are dominant or almost useless. Data is still important, but apart from being a rough guide, I think its weight is often overstated and find some of the Stats shared here misleading. Maybe a new standardized "Impact Rating" is the way forward? Thoughts?
Four checks before comparing players
- Format: Are both figures from Test cricket, ODIs or T20s, or is the comparison mixing formats?
- Role and phase: Did the players perform comparable jobs, such as opening versus finishing or new-ball versus death-overs bowling?
- Sample: How many runs, balls, dismissals or credited wickets support each rate?
- Conditions and opposition: Are the pitch, ground, weather and opposition relevant to the difference?
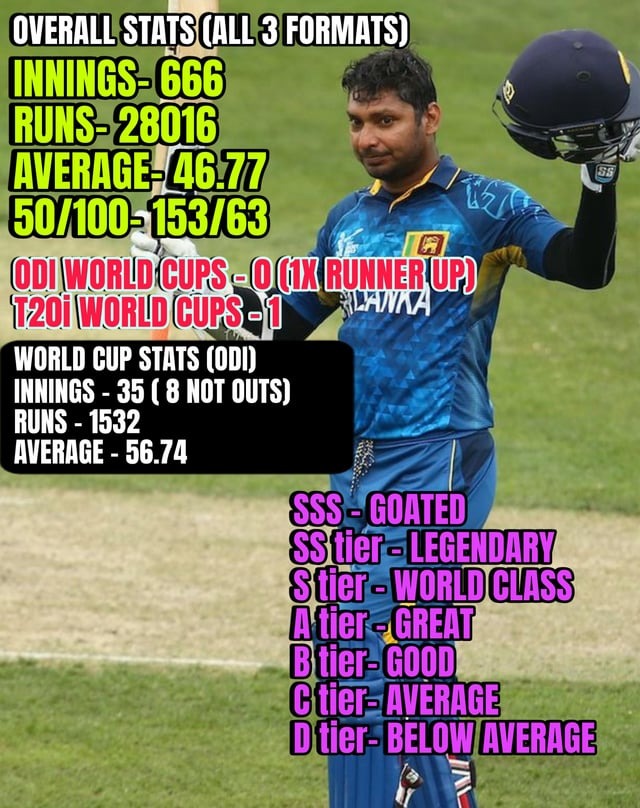
The published figures still record what happened. The four checks show where your own judgment comes in.
Team Run Rate and Net Run Rate Are Not Player Statistics
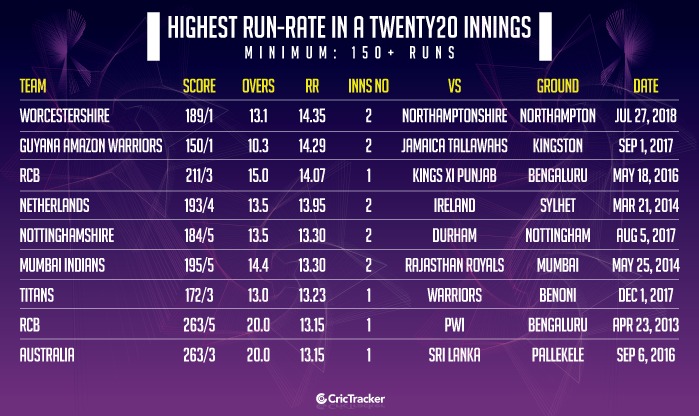
Team run rate is runs scored per over in an innings, and required run rate is the pace needed to reach a chase target. Net run rate (NRR) compares a team's scoring and conceding rates for tournament standings. All-outs and reduced-over games change that calculation, so the NRR guide covers the method.
Put the Numbers Together: Reading a Simple Scorecard
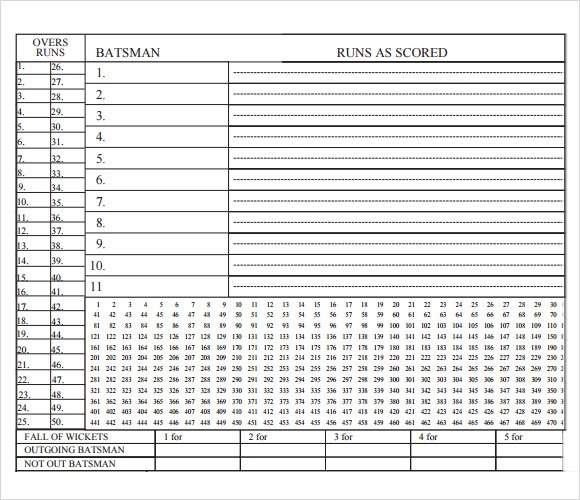
A batter's line reads more clearly beside the team's. Take 45 (30) with the side on 80/2 after 10 overs.
The batter's strike rate is 150, or nine runs per six balls faced. The team is scoring at eight runs per over. The batter is scoring faster than the side, which the 45 alone doesn't show.
Whether that pace is enough depends on the target, the wickets in hand and the stage of the innings. The notation 45 (30) also says nothing about whether the batter was dismissed; the dismissal field or a not-out marker shows that.
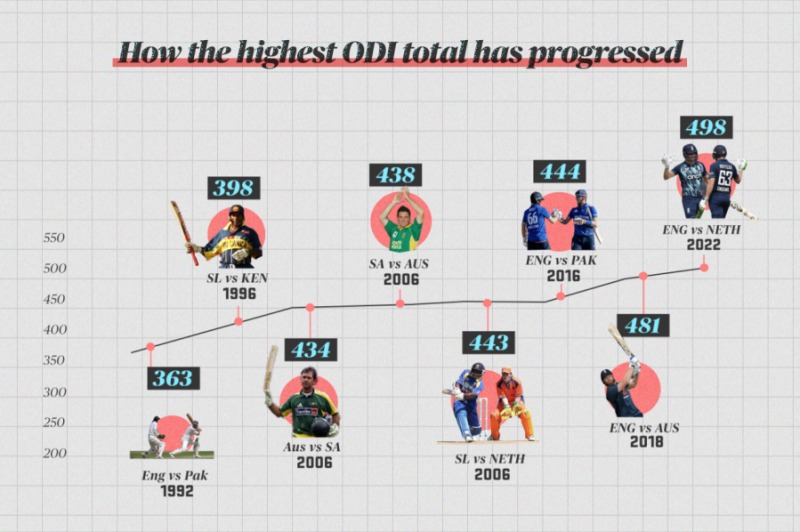
A fan learning to read first-class scorecards described wanting to see how figures relate, including a batter's strike rate against the team's rate:
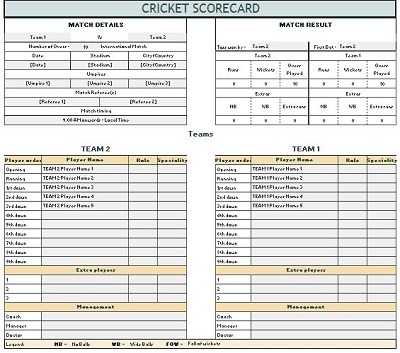
Getting deeper into first-class cricket after years of following other sports, and I've been teaching myself to read scorecards properly rather than just results. I've got the basics: top-order contributions, bowling figures, extras as a sign of discipline. But I keep noticing that experienced fans seem to extract a whole layer of meaning I'm not seeing yet. So I'm curious: what's the specific thing you look at (a ratio, a pattern, a comparison between two numbers) that tells you something real about what happened in a match, but that most people scroll straight past? Could be anything: the relationship between a batter's strike rate and the team's run rate at the time, what leg byes tell you about a bowler's control, how tail-end strike rates reveal what the top order was doing, fall-of-wickets clusters; whatever it is for you. Not looking for textbook answers. I want the thing that you personally trained yourself to notice.
- Whose statistic?
45 (30)belongs to the batter;80/2is the team's score;3.4/0/29is the bowler's spell, giving overs, maidens and runs conceded. - What denominator? The batter's 30 balls faced produce a strike rate, while the team's 10 overs give its run rate. With no wickets listed for the bowler, you can't work out an average or strike rate.
- What match context? The target, remaining overs and wickets decide how much the faster scoring helps the innings.
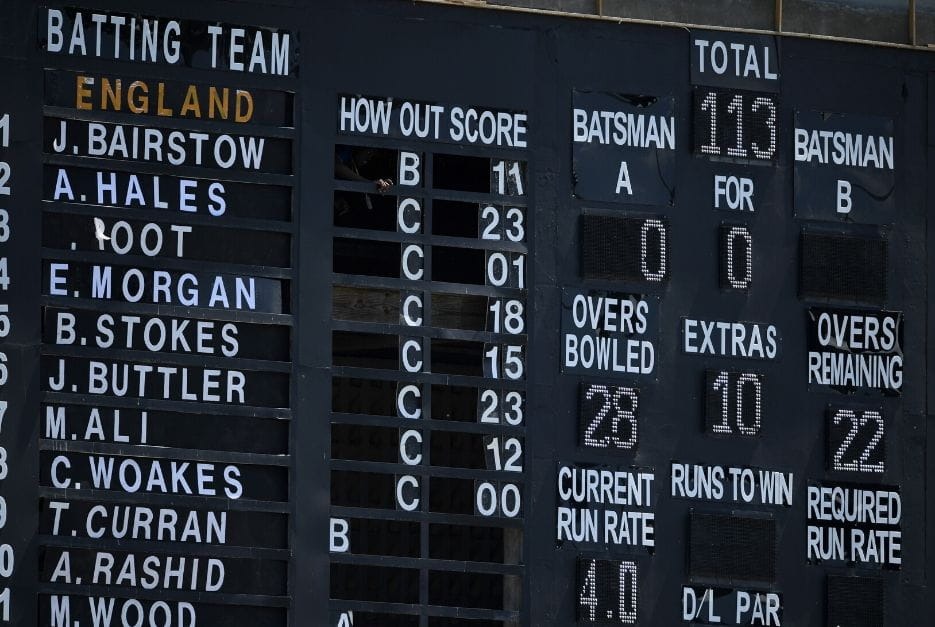
Batting average, strike rate and economy each describe something different, so the right one depends on the decision in front of you. Pick a player, check the role and use the number that answers your question.